BuildingPulse energy monitoring. Your Building
has a Pulse.
BuildingPulse reads your electric meter every few minutes and turns it into four answers you can act on.
Live
See the peak while you can still stop it.
A demand charge is set by the highest fifteen minutes of the month. The Live page shows that number forming, beside what is usual for the hour and the limit you set.
for this month.
Sample data, drawn to match the live card. Tap a red dot or its heading to see what it shows.
Now, against usual
Live demand beside this building’s own average for the weekday and the hour.
The last 24 hours
Colored from green to red as demand climbs. Zoom in to the last few hours or out to the whole week.
Demand this cycle
One bar carries where you are now, this cycle’s peak and your limit.
This month’s peak
The reading that sets the demand charge, with the day, the time and the weather when it happened.
Your limit
A ceiling you choose. The page warns you when demand is on course to cross it within the half hour.
Where FMC has tied BuildingPulse into your energy management system, a Shed Load button rises on this card as demand nears the peak or your limit. Further down the page: Demand Outlook for the next 36 hours, Hourly Energy Heatmap, Load Duration Curve and Typical Day Profile.
Open Live in the demoUsage
Know where the month will land.
The Usage page projects month-end use from the days so far, then holds it against last month and the limit you set.
for this month.
Sample data, drawn to match the live card. Tap a red dot or its heading to see what it shows.
Projected usage
Where the month ends at today’s pace, compared day for day with last month. The sun switch takes the weather out of the comparison.
Month by month
Use per day, so a short month and a long one compare fairly. This month’s likely range is drawn before the meter finishes it.
Last month, for scale
Tap it to compare with the six-month average or the same month last year.
Your monthly limit
The line above it says how much of the limit the month is on course to use.
Further down the page: Where Your Energy Goes, Weekday vs. Weekend and After-Hours Energy.
Open Usage in the demoEmissions
Count carbon by the hour.
The same kilowatt-hour is cleaner at 3 AM than on a hot afternoon. The Emissions page multiplies your metered demand by the New England grid’s carbon intensity, hour by hour.
Sample data, drawn to match the live card. Tap a red dot or its heading to see what it shows.
Projected emissions
Month-end CO2e at today’s pace, against last month.
A week of hours, or a year of months
Monthly totals are colored by how clean the grid ran that month.
Your rate, on the grid’s clock
The line is your building. The shading behind it is how clean New England’s power was at that hour.
In everyday terms
The month’s total as gallons of gasoline, miles driven and tree seedlings.
In Boston or Cambridge? For a building covered by BERDO or BEUDO, FMC can set this page to track the calendar year against the city’s emissions limit instead.
Further down the page: Grid Emissions, CO2e Intensity Heatmap and Monthly Carbon Trend.
Open Emissions in the demoCosts
Read the bill before it arrives.
The Costs page projects this month’s electric bill and splits it into the two things you pay for: the energy you used and the highest fifteen minutes.
2026October
2026November
2025
How the projected cost splits between usage cost and the highest 15-minute demand charge.
Sample data, drawn to match the live card. Tap a red dot or its heading to see what it shows.
Projected bill
This month’s bill at today’s pace, with the change from last month in dollars.
Any month, on your billing cycle
Days are counted on your utility’s cycle, not the calendar. Compare with last month, last year or any month on record.
Usage cost
Projected kilowatt-hours times your energy rate.
Demand charge
This month’s highest fifteen-minute reading times your demand rate. In this sample, the larger half.
Further down the page: Bill Savings Forecaster, The Peak That Set Your Bill, Your Daily Spend and Cost History.
Open Costs in the demoAt your desk, or on the go.
BuildingPulse opens in any web browser on your computer, and in the FMC Hub app on your iPhone and iPad. It is the same building, the same four pages and the same numbers, wherever you check them.
See the FMC Hub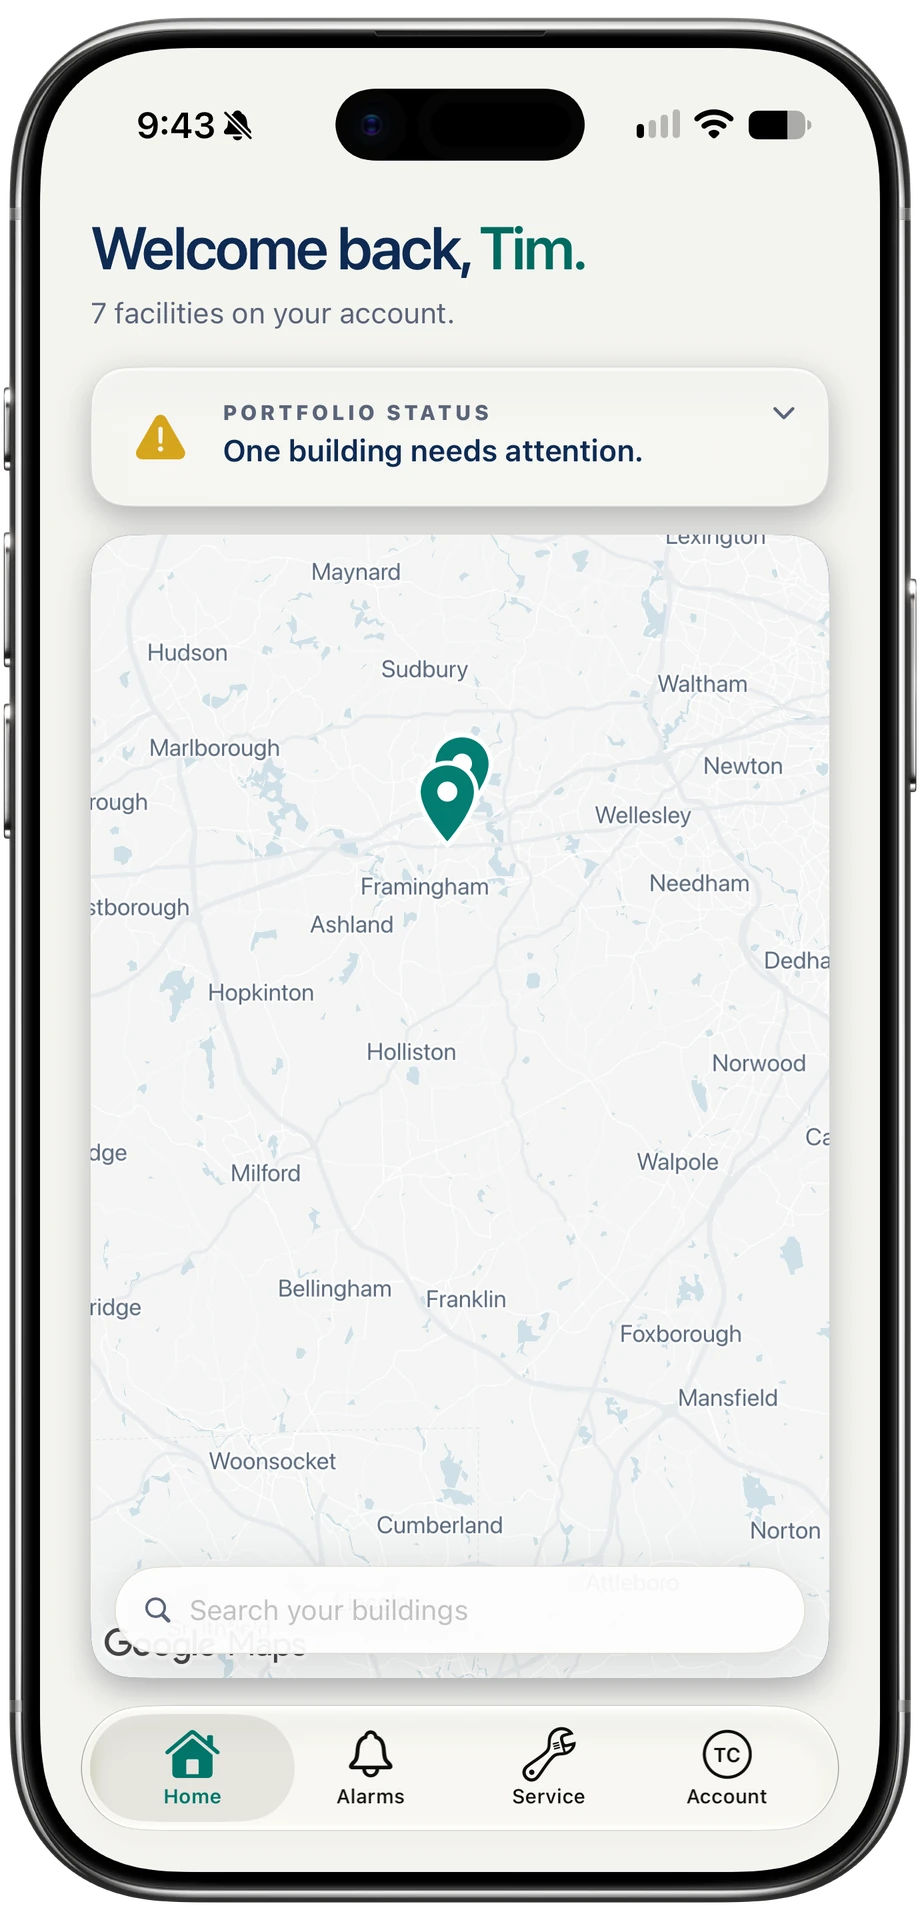
Sample data, drawn to match the dashboard.
From your meter to these four pages.
-
Check your meter
Your electric meter either has a pulse output already, or it needs a smart meter installed. Two questions about your meter tell us which.
-
FMC connects it
Our own technicians connect to your meter’s pulse output, or install the smart meter, and bring your building into the FMC Hub.
-
Your building goes live
Readings start arriving every few minutes. Scan last month’s electric bill once, and every dollar figure uses your real rates.
Start with your meter.
The eligibility check takes a few minutes and ends with the install that fits your building.