-
Measure, manage, and maintain the energy performance of your building.
We help your building use less energy through better controls, a practical savings plan, and ongoing support.
Measure the opportunity.
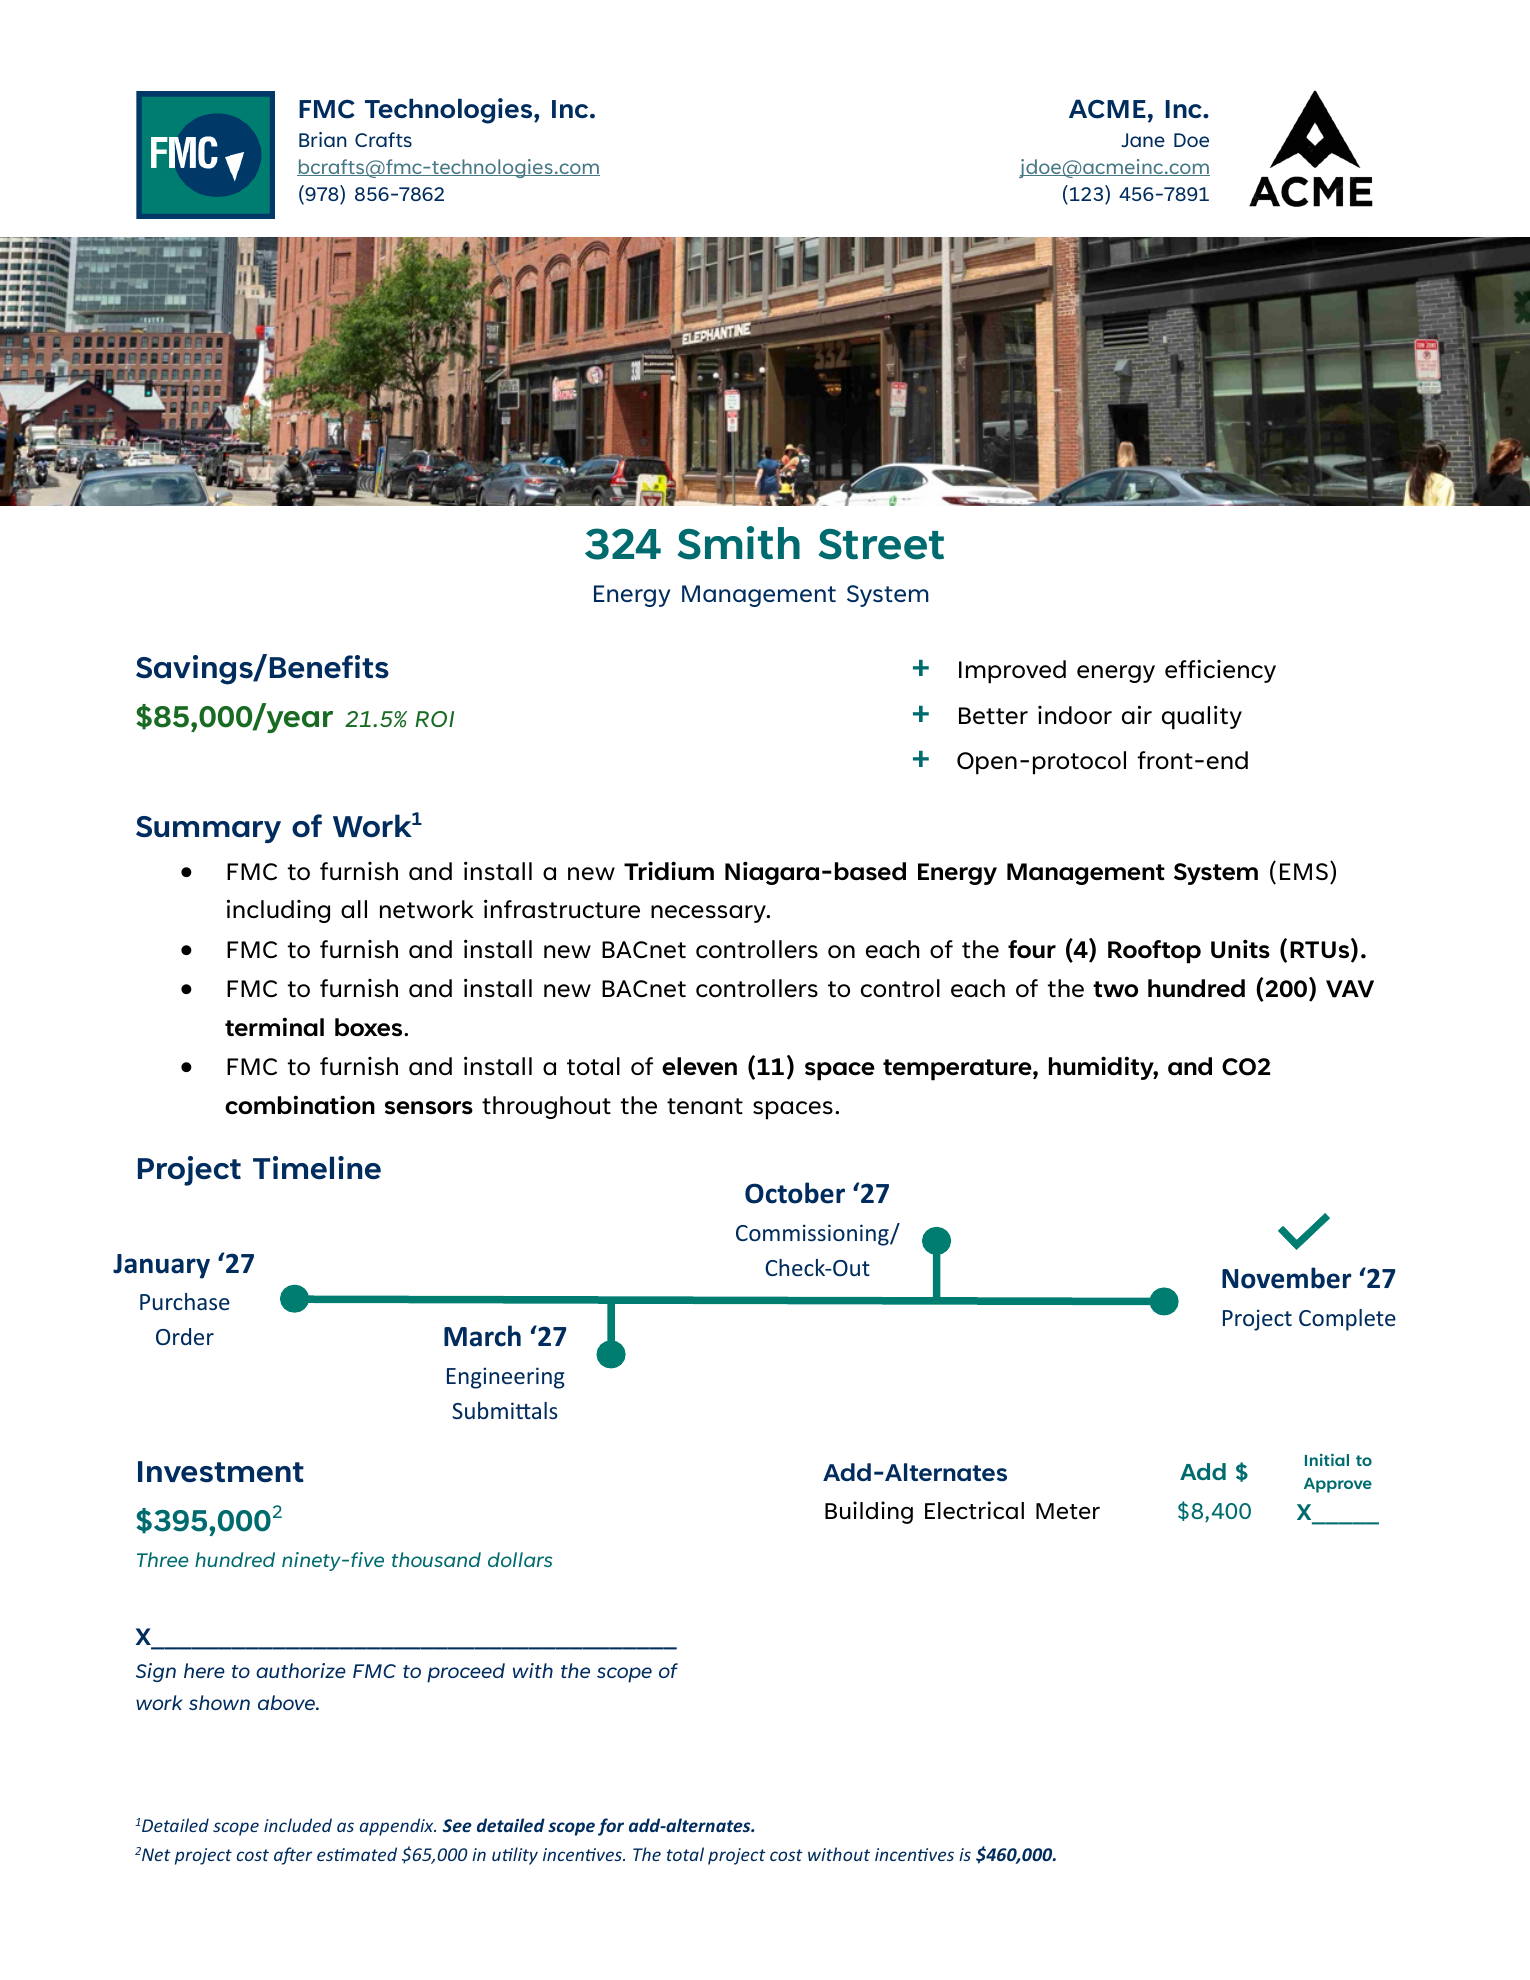
Before the project starts, FMC benchmarks your building’s current energy performance against ENERGY STAR, estimates operating-cost reductions, and applies for utility incentives on your behalf.
Project cost$460,000Potential incentive−$65,000Net investment$395,000Annual savings$85,000Simple payback4.6 yearsAfter incentivesSavings and ROI calculations are for demo purposes only and do not reflect a real project.
-
Manage how the building runs.
FMC designs and installs your energy management system, with schedules and operating sequences that match how your building is used.
The rooftop supply fan starts turning and airflow appears once the schedule tool below is live.
Before
HVAC runs around the clock, conditioning outside air even when the building is empty.
After
HVAC follows the working day and shuts down when it isn’t needed.
24 hours a day 12:00 AM – 12:00 AMDrag this handle, tap the track, or use the arrow keys. One-hour steps, one hour minimum.
Annual energy savings n/aSimple payback n/aMore ways controls save
The schedule figures above come from an illustrative model calibrated to the sample proposal’s $85,000/year at 8 AM–6 PM. Not a prediction for your building. Payback is after incentives.
Benchmark-scaled examples for this building, not measured averages. Not additive with each other or with the schedule figure above.
-
Enable JavaScript to load the simulated Live tile.
Press SHED LOAD to see demand drop.
Potential extra demand charge avoided n/aOpen BuildingPulse DemoMaintain energy performance.
After installation, BuildingPulse helps you track energy use and costs, spot performance changes, and decide when to act on demand.
Energy (kWh) is how much electricity you use over time. Demand (kW) is how much you draw at once. Many commercial bills charge for both, with demand based on the highest short-interval average, which is 15 minutes in this example.
Try one demand decision below: briefly ease approved, noncritical loads before a new peak is recorded. This simulates a load reduction; it does not control a real building.
More information on BuildingPulse
Enable JavaScript to load the BuildingPulse cards.
-
Usage
How much electricity the building has used this month and where the month is projected to land, checked against a usage limit. It also shows whether consumption is rising or falling against the building’s own recent history.
-
Emissions
The carbon tied to that electricity, following the grid it came from rather than a flat annual factor. Grid hours are shaded from clean to high behind the building’s own rate, and the month is put in everyday terms.
-
Costs
The projected bill: energy charges for what you used, plus any demand charge set by the peak interval, 15 minutes here. The breakdown shows how much of the bill a single peak is driving.
See the full BuildingPulse demo -
Start with the walkthrough.
It is how the incentive estimate, the list of control changes and the payback get real numbers. Bring the last twelve months of utility bills and we will do the rest.